

India National Cricket Team Vs Australia Men’s Cricket Team Stats
Table of Contents
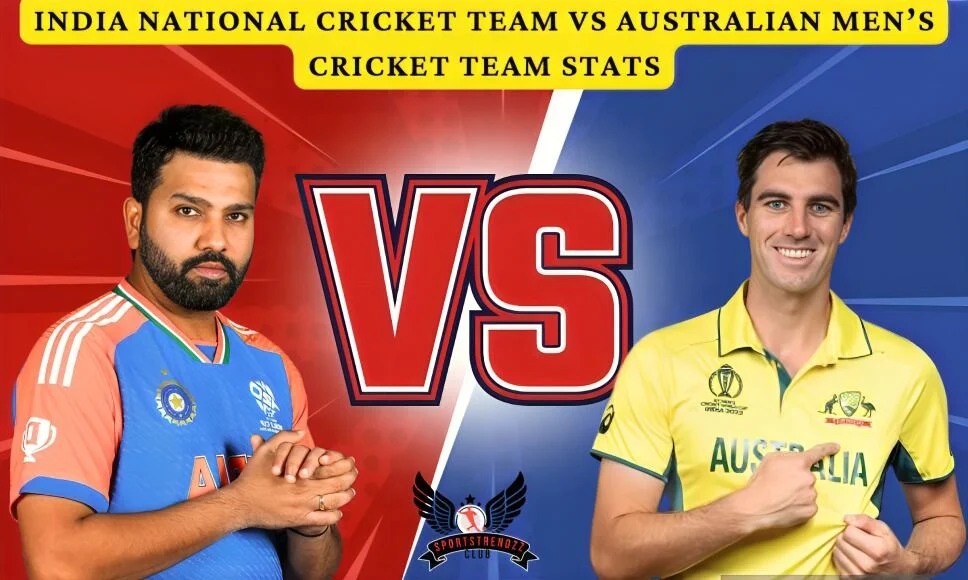
The India-Australia rivalry is one of the most closely followed contests in international cricket. Across Tests, ODIs, and T20Is, the two teams have produced historic batting performances, outstanding bowling spells, dramatic collapses, and memorable tournament encounters. Australia have traditionally held the stronger overall record in Tests and ODIs, while India have built a stronger head-to-head record in T20Is. The rivalry has featured legendary players such as Sachin Tendulkar, Ricky Ponting, VVS Laxman, Anil Kumble, Virat Kohli, Rohit Sharma, Steve Smith, Nathan Lyon, and Jasprit Bumrah. This article examines the major statistics behind the contest, including head-to-head records, batting and bowling numbers, highest and lowest totals, individual records, recent meetings, and the performances that have shaped the rivalry.
Head-to-Head Stats
India and Australia have played more than 300 men’s international matches across the three major formats. The balance is different in each format, which makes a format-by-format comparison more useful.
| Format | Matches | India Wins | Australia Wins | Draw/No Result | Tied |
| Tests | 112 | 33 | 48 | 30 Draws | 1 |
| ODIs | 155 | 59 | 86 | 10 No Results | 0 |
| T20Is | 37 | 22 | 12 | 3 No Results | 0 |
The numbers show Australia’s historical advantage in Test and ODI cricket, while India have the stronger T20I record. The tied Test between the teams came in Chennai in 1986 and remains one of the rarest results in Test history.
Australia have won 48 of the 112 Tests against India, while India have won 33. Thirty matches have ended in draws and one has been tied. The teams first met in Test cricket during Australia’s tour of India in 1947-48, beginning a rivalry that has continued across several generations.
In ODIs, Australia lead 86-59 from 155 meetings, with 10 matches producing no result. Australia dominated many of the earlier ODI encounters, although India have produced important victories in major ICC tournaments and bilateral series.
T20Is provide a different picture. India have won 22 of the 37 matches, while Australia have won 12. Three matches have ended without a result. India’s stronger T20I record reflects their consistency in the modern shortest format.
Batting Statistics
Sachin Tendulkar is the leading Test run-scorer in India-Australia matches with 3,630 runs. He averaged 55.00 and scored 11 centuries against Australia. His record is especially significant because his runs came against several generations of Australian bowling attacks.
| Player | Team | Runs | Average | Highest Score |
| Sachin Tendulkar | India | 3,630 | 55.00 | 241* |
| Ricky Ponting | Australia | 2,555 | 54.36 | 257 |
| VVS Laxman | India | 2,434 | 49.67 | 281 |
| Rahul Dravid | India | 2,143 | 39.68 | 233 |
| Michael Clarke | Australia | 2,049 | 53.92 | 329* |
| Steve Smith | Australia | 2,042 | 65.87 | 192 |
| Virat Kohli | India | 2,042 | 47.48 | 186 |
| Matthew Hayden | Australia | 1,888 | 59.00 | 203 |
Ricky Ponting is Australia’s leading run-scorer in the Test rivalry among these players, while VVS Laxman became particularly famous for producing match-changing performances against Australia. Steve Smith’s high average shows his remarkable efficiency when facing Indian bowling, while Virat Kohli has been one of India’s most important modern contributors.
India’s ODI batting record is also led by Tendulkar, who scored 3,077 runs against Australia. Rohit Sharma and Virat Kohli occupy prominent positions among the modern-era run-scorers.
| Player | Team | Runs | Average | Highest Score |
| Sachin Tendulkar | India | 3,077 | 44.59 | 175 |
| Rohit Sharma | India | 2,609 | 59.29 | 209 |
| Virat Kohli | India | 2,525 | 53.72 | 123 |
| Ricky Ponting | Australia | 2,164 | 40.07 | 140* |
| MS Dhoni | India | 1,660 | 44.86 | 139* |
Rohit Sharma’s 2,609 runs and 59.29 average stand out because of the combination of volume and efficiency. His 209 remains the highest individual ODI score in this rivalry.
In T20Is, Virat Kohli has been one of India’s most consistent batters against Australia. His ability to construct innings under pressure has made him particularly effective in high-stakes matches.
| Player | Team | Runs | Highest Score |
| Virat Kohli | India | 794 | 90* |
| Glenn Maxwell | Australia | 574 | 113* |
| Aaron Finch | Australia | 500 | 89 |
| Matthew Wade | Australia | 488 | 80 |
| Rohit Sharma | India | 484 | 92 |
Glenn Maxwell is Australia’s standout run-scorer in the listed T20I statistics. His aggressive style allows him to change a match within a few overs, while Kohli’s record has been built more around consistency and innings control.
Bowling Statistics
Nathan Lyon leads the Test wicket-taking charts in India-Australia matches with 121 wickets. His longevity and ability to bowl long spells have made him one of Australia’s most important bowlers in the modern Border-Gavaskar era.
| Bowler | Team | Wickets | Average | Five-Wicket Hauls |
| Nathan Lyon | Australia | 121 | 31.56 | 9 |
| Ravichandran Ashwin | India | 114 | 28.36 | 7 |
| Anil Kumble | India | 111 | 30.32 | 10 |
| Harbhajan Singh | India | 95 | 29.95 | 7 |
| Ravindra Jadeja | India | 89 | 19.29 | 5 |
India’s leading wicket-takers are dominated by spin bowlers. Kumble, Harbhajan, Ashwin, and Jadeja have all used variations in flight, pace, and turn to challenge Australian batters. Jadeja’s low average is particularly notable among the leading wicket-takers.
Brett Lee leads the ODI wicket-taking list in India-Australia matches with 55 wickets. His pace and aggressive attacking approach made him a major threat to India’s batting lineups.
| Bowler | Team | Wickets | Best Bowling |
| Brett Lee | Australia | 55 | 5/27 |
| Kapil Dev | India | 45 | 5/43 |
| Mitchell Johnson | Australia | 43 | 5/26 |
| Steve Waugh | Australia | 43 | 5/50 |
| Ajit Agarkar | India | 36 | 6/42 |
The list covers several eras of international cricket. Kapil Dev represents an earlier generation of Indian pace bowling, while Lee and Johnson were part of Australia’s powerful fast-bowling attacks.
In T20Is, Jasprit Bumrah and Axar Patel have been important contributors for India, while Australia have relied on bowlers such as Jason Behrendorff and Adam Zampa.
| Bowler | Team | Wickets | Best Figures |
| Jasprit Bumrah | India | 17 | 3/16 |
| Axar Patel | India | 15 | 3/16 |
| Jason Behrendorff | Australia | 13 | 4/21 |
| Adam Zampa | Australia | 12 | 3/16 |
| Ravichandran Ashwin | India | 10 | 4/11 |
T20 bowling requires accuracy because batters are constantly searching for scoring opportunities. Bumrah’s variations and Axar’s control have made them especially valuable against Australia’s aggressive batting approach.
Highest Team Totals
India’s highest Test total against Australia is 705/7 declared, while Australia’s highest is 659/4 declared. Both totals demonstrate the batting depth available to the two teams during dominant Test performances.
| Team | Format | Highest Total |
| India | Tests | 705/7d |
| Australia | Tests | 659/4d |
| India | ODIs | 399/5 |
| Australia | ODIs | 389/4 |
| India | T20Is | 235/4 |
| Australia | T20Is | 225/5 |
The ODI figures show how scoring has accelerated over the years. India have reached 399/5 against Australia, while Australia have produced 389/4. Both totals require sustained scoring from the top order and strong contributions from the middle order.
In T20Is, India’s highest total against Australia is 235/4, while Australia’s highest is 225/5. Scores above 220 are especially significant in T20 cricket because they require an exceptional scoring rate across the innings.
Lowest Team Totals
India’s 36 all out against Australia in Adelaide in 2020 remains one of the most memorable batting collapses in modern Test cricket. Australia won that match by eight wickets after India’s second innings lasted only a short period.
| Team | Format | Lowest Total |
| India | Tests | 36 |
| Australia | Tests | 83 |
| India | ODIs | 63 |
| Australia | ODIs | 101 |
| India | T20Is | 74 |
| Australia | T20Is | 86 |
The contrast between the highest and lowest totals is striking. India have scored more than 700 in a Test against Australia but have also been dismissed for only 36. Australia have similarly moved from totals above 650 to an 83 all-out collapse.
India’s lowest ODI score against Australia is 63, while Australia’s lowest is 101. These totals came during earlier periods of ODI cricket, when scoring patterns were significantly different from today’s game.
In T20Is, India have been dismissed for 74 against Australia, while Australia’s lowest total is 86. Both scores show how quickly an innings can collapse when wickets fall in clusters.
Top Individual Scores
Michael Clarke holds the highest individual Test score in India-Australia matches with 329 not out. India’s highest score is VVS Laxman’s 281, which came during the famous 2001 Kolkata Test.
| Player | Team | Score |
| Michael Clarke | Australia | 329* |
| VVS Laxman | India | 281 |
| Ricky Ponting | Australia | 257 |
| Sachin Tendulkar | India | 241* |
| Virender Sehwag | India | 195 |
Clarke’s 329 demonstrates how a strong start can be converted into a massive individual score. Laxman’s 281 is remembered for its match situation because it helped India recover from a difficult position against Australia.
Rohit Sharma’s 209 is the highest individual ODI score in India-Australia matches. The innings combined power hitting with the ability to maintain scoring throughout a long ODI innings.
| Player | Team | Score |
| Rohit Sharma | India | 209 |
| Sachin Tendulkar | India | 175 |
| Shane Watson | Australia | 164 |
| Steve Smith | Australia | 149 |
| Virat Kohli | India | 123 |
The ODI list contains several players who have repeatedly performed against high-quality attacks. Rohit’s double century remains the standout individual batting performance in the format.
Shane Watson has the highest individual T20I score in the rivalry with an unbeaten 124. Ruturaj Gaikwad’s unbeaten 123 is another extraordinary performance, while Glenn Maxwell’s 113 not out highlights Australia’s ability to produce explosive innings.
| Player | Team | Score |
| Shane Watson | Australia | 124* |
| Ruturaj Gaikwad | India | 123* |
| Glenn Maxwell | Australia | 113* |
| Virat Kohli | India | 90* |
| Aaron Finch | Australia | 89 |
These innings demonstrate the importance of acceleration in T20 cricket. A single batter can contribute more than half of a team’s total in a high-scoring match.
Best Bowling Performances
Jasubhai Patel’s 9/69 remains one of India’s most remarkable innings bowling performances against Australia in Test cricket. Nathan Lyon has also produced an outstanding 8/50, while Anil Kumble’s 8/141 remains an important performance from the previous generation.
| Bowler | Team | Figures |
| Jasubhai Patel | India | 9/69 |
| Nathan Lyon | Australia | 8/50 |
| Anil Kumble | India | 8/141 |
| Ravichandran Ashwin | India | 7/103 |
The figures show the importance of spin in this rivalry. Indian spinners have historically been particularly effective in home conditions, while Australia’s leading spinners have played major roles when the teams have met in Australia.
Murali Kartik produced India’s standout ODI bowling performance against Australia with 6/27. Australia’s best performances have also included memorable spells from bowlers such as Ken MacLeay and Mitchell Johnson.
| Bowler | Team | Figures |
| Murali Kartik | India | 6/27 |
| Ken MacLeay | Australia | 6/39 |
| Ajit Agarkar | India | 6/42 |
| Mitchell Johnson | Australia | 5/26 |
These performances demonstrate that wicket-taking against the opposition’s strong batting lineups has come from different bowling styles, including left-arm spin, pace, bounce, and conventional seam movement.
Ravichandran Ashwin’s 4/11 is one of the most economical standout spells in India-Australia T20I cricket. Jason Behrendorff has also taken four wickets in a match, while Bumrah and Zampa have produced important three-wicket spells.
| Bowler | Team | Figures |
| Ravichandran Ashwin | India | 4/11 |
| Jason Behrendorff | Australia | 4/21 |
| Jasprit Bumrah | India | 3/16 |
| Adam Zampa | Australia | 3/16 |
The T20I figures underline how quickly a bowling spell can alter a match. Taking multiple wickets while keeping the economy rate under control can prevent an opposition side from reaching a winning total.
Interesting Statistical Facts
Sachin Tendulkar’s 3,630 Test runs against Australia remain the biggest individual batting tally in the Test rivalry. His 11 centuries demonstrate that he was not simply accumulating runs but regularly converting strong starts into major scores.
India’s T20I record is significantly stronger than their Test and ODI records. Their 22 victories from 37 T20Is represent a clear statistical advantage over Australia’s 12 wins.
Australia’s 86 ODI victories remain comfortably ahead of India’s 59. However, India’s record includes important wins in major ICC tournaments, where individual matches have carried greater significance than ordinary bilateral fixtures.
The rivalry also includes one tied Test, played in Chennai in 1986. Both sides finished with identical aggregate scores, making the match one of the rarest results in Test cricket.
The statistical extremes are equally striking. India have scored 705/7 declared in a Test against Australia but have also been dismissed for 36. Australia have reached 659/4 declared but have also been dismissed for 83. These figures illustrate the dramatic swings that have occurred throughout the rivalry.
Head-to-Head Record
The format-by-format record provides a clearer picture than an overall combined figure. Australia have the stronger historical record in Tests and ODIs, while India have won more T20Is.
| Category | India | Australia |
| Test Wins | 33 | 48 |
| ODI Wins | 59 | 86 |
| T20I Wins | 22 | 12 |
| Test Highest Total | 705/7d | 659/4d |
| ODI Highest Total | 399/5 | 389/4 |
| T20I Highest Total | 235/4 | 225/5 |
The record also shows how the balance has evolved. Australia’s historical dominance was particularly strong in ODI cricket, while India’s rise in T20 cricket has produced a much more favorable record.
India and Australia have also met repeatedly in major ICC competitions. Their World Cup, T20 World Cup, Champions Trophy, and World Test Championship encounters have produced some of the most important matches between the two sides.
| ICC Competition | Matches | India Wins | Australia Wins | No Result |
| Cricket World Cup | 14 | 5 | 9 | 0 |
| T20 World Cup | 6 | 4 | 2 | 0 |
| Champions Trophy | 5 | 3 | 1 | 1 |
| World Test Championship Final | 1 | 0 | 1 | 0 |
The tournament figures provide a separate perspective because several of these meetings have taken place in knockout stages or finals. Those matches have produced some of the rivalry’s most remembered performances.
Recent Meetings
The 2024-25 Border-Gavaskar Trophy was the latest completed Test series between India and Australia. India won the first match in Perth by 295 runs, but Australia responded strongly and eventually won the series 3-1.
| Test | Result |
| Perth, 2024 | India won by 295 runs |
| Adelaide, 2024 | Australia won by 10 wickets |
| Brisbane, 2024 | Draw |
| Melbourne, 2024 | Australia won by 184 runs |
| Sydney, 2025 | Australia won by 6 wickets |
The series showed how quickly momentum can shift in Test cricket. India started with a dominant victory, but Australia won the next two completed Tests before securing the series in Sydney.
The teams also played a three-match ODI series in October 2025. Australia won the first two matches before India finished with a nine-wicket victory.
| Date | Result |
| October 19, 2025 | Australia won by 7 wickets |
| October 23, 2025 | Australia won by 2 wickets |
| October 25, 2025 | India won by 9 wickets |
India had also defeated Australia in the 2025 Champions Trophy semifinal. That result added another important knockout match to the long history between the teams.
India won the 2025 T20I series in Australia 2-1, with one match ending without a result. The outcome continued India’s strong T20I record against Australia.
| Result | Series Outcome |
| India | Won series 2-1 |
| Australia | Won 1 match |
| No Result | 1 match |
The recent T20I results also demonstrate the importance of adaptable players who can contribute across different phases of an innings or bowling spell.
Major Records
The leading records in the rivalry have been created by players from several generations. Some belong to legendary players from the 1980s, 1990s, and 2000s, while others have been established during the modern era.
| Record | Player/Team | Figure |
| Most Test runs | Sachin Tendulkar | 3,630 |
| Most Test wickets | Nathan Lyon | 121 |
| Highest Test score | Michael Clarke | 329* |
| Highest Indian Test score | VVS Laxman | 281 |
| Most ODI runs | Sachin Tendulkar | 3,077 |
| Most ODI wickets | Brett Lee | 55 |
| Highest ODI score | Rohit Sharma | 209 |
| Best ODI bowling | Murali Kartik | 6/27 |
| Most T20I runs | Virat Kohli | 794 |
| Highest T20I score | Shane Watson | 124* |
| Highest Indian T20I score | Ruturaj Gaikwad | 123* |
| Highest T20I team score | India | 235/4 |
These records show that the rivalry has never belonged to one particular generation. Tendulkar and Ponting dominated many statistical categories during the earlier period, while Kohli, Rohit, Smith, Lyon, Bumrah, and other modern players have added new records and performances.
Conclusion
The statistical history of India and Australia shows why this rivalry has remained one of international cricket’s most important contests. Australia have the stronger historical record in Tests and ODIs, while India have the advantage in T20Is. The Test record includes 112 matches, with Australia winning 48 and India winning 33. In ODIs, Australia lead 86-59, while India have won 22 of the 37 T20Is between the sides.
The individual records add another dimension to the rivalry. Sachin Tendulkar’s 3,630 Test runs, Nathan Lyon’s 121 wickets, Michael Clarke’s 329 not out, Rohit Sharma’s 209, and Shane Watson’s 124 not out represent different eras of excellence. The teams have also produced extraordinary extremes, from totals above 650 in Tests to dramatic collapses below 100. Together, these numbers provide a statistical picture of a rivalry built on longevity, high-quality players, major tournament encounters, and memorable performances.
Frequently Asked Questions
How many times have India and Australia played each other?
By the end of 2025, India and Australia had played 112 Tests, 155 ODIs, and 37 T20Is. Their meetings include bilateral series as well as World Cups, Champions Trophy matches, T20 World Cup games, and the World Test Championship final.
Who has scored the most runs in India vs Australia Tests?
Sachin Tendulkar is the leading Test run-scorer in the rivalry with 3,630 runs. He averaged 55.00 and scored 11 centuries against Australia, making his record one of the most significant batting achievements in the fixture.
Who has taken the most wickets in India vs Australia Tests?
Nathan Lyon has taken the most Test wickets in India-Australia matches, with 121 wickets. India’s leading wicket-takers include Ravichandran Ashwin and Anil Kumble, both of whom passed 100 wickets against Australia.
Who has the highest individual score in India vs Australia cricket?
Michael Clarke has the highest individual Test score with 329 not out. Rohit Sharma holds the highest ODI score with 209, while Shane Watson’s unbeaten 124 is the highest individual T20I score in the rivalry.
Which team has more wins between India and Australia?
The answer varies by format. Australia have more Test wins, with 48 compared with India’s 33, and lead the ODI record 86-59. India have the stronger T20I record, leading Australia 22-12.