
India National Cricket Team Vs England Cricket Team Match Scorecard 1st Test
Table of Contents
The 1st Test between the India National Cricket Team and the England Cricket Team always sets the tone for the entire series. It is where strategies unfold, conditions are tested, and early dominance is established. The match scorecard from a 1st Test reflects patience, discipline, and long sessions of cricket that define the traditional format.
Latest Matches
| Tournament | Venue | Date | Toss | India Score | England Score | Result | Series | Player of the Match |
| T20 World Cup | Wankhede Stadium, Mumbai | Mar 5, 2026 | England (field) | 253/7 (20 ov) | 246/7 (20 ov) | India won by 7 runs | T20 World Cup | Sanju Samson (IND) |
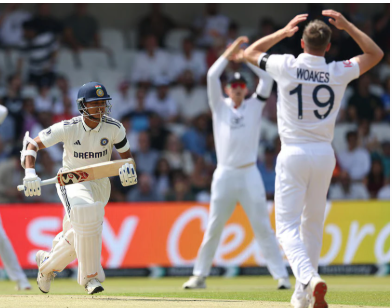
| Bilateral Test | The Oval, London | Jul 31-Aug 4, 2025 | England (field) | 224 & 396 | 247 & 367 | India won by 6 runs | Anderson-Tendulkar Trophy | Jasprit Bumrah (IND) |
| Bilateral Test | Old Trafford, Manchester | Jul 23-27, 2025 | England (field) | 358 & 425/4 | 669 | Match Drawn | Anderson-Tendulkar Trophy | Shubman Gill (IND) |
| Bilateral Test | Lord’s, London | Jul 10-14, 2025 | England (bat) | 387 & 170 | 387 & 192 | England won by 22 runs | Anderson-Tendulkar Trophy | Ben Stokes (ENG) |
| Bilateral Test | Headingley, Leeds | Jun 20-24, 2025 | England (field) | 471 & 364 | 465 & 373/5 | England won by 5 wkts | Anderson-Tendulkar Trophy | Ben Duckett (ENG) |
| Bilateral ODI | Narendra Modi Stadium, Ahmedabad | Feb 12, 2025 | India (bat) | 356 | 214 | India won by 142 runs | Bilateral ODI | Virat Kohli (IND) |
| Bilateral T20I | Wankhede Stadium, Mumbai | Feb 2, 2025 | England (field) | 247/9 (20 ov) | 97 (10.3 ov) | India won by 150 runs | Bilateral T20I | Abhishek Sharma (IND) |
All-Time Batting Leaders
| Rank | Player | Team | Matches | Runs | Average | Highest Score | 100s |
| 1 | Joe Root | ENG | 30 | 2846 | 58.08 | 218 | 10 |
| 2 | Sachin Tendulkar | IND | 32 | 2535 | 51.73 | 193 | 7 |
| 3 | Sunil Gavaskar | IND | 38 | 2483 | 38.20 | 221 | 4 |
| 4 | Alastair Cook | ENG | 30 | 2431 | 47.66 | 294 | 7 |
| 5 | Virat Kohli | IND | 28 | 1991 | 42.36 | 235 | 5 |
All-Time Bowling Leaders
| Rank | Player | Team | Matches | Wickets | Average |
| 1 | James Anderson | ENG | 39 | 149 | 25.47 |
| 2 | Ravichandran Ashwin | IND | 24 | 114 | – |
| 3 | B.S. Chandrasekhar | IND | 23 | 95 | 2.50 |
| 4 | Anil Kumble | IND | 19 | 92 | 2.62 |
| 5 | Bishan Singh Bedi | IND | 22 | 85 | 2.12 |
All-Time Head-to-Head Record
| Format | Matches Played | India Won | England Won | Drawn/Tied/No Result |
| Test | 141 | 37 | 53 | 51 Drawn |
| ODI | 110 | 61 | 44 | 3 NR + 2 Tied |
| T20I | 30 | 18 | 12 | 0 |
| Overall | 281 | 116 | 109 | 56 |
Opening Day Drama and Early Momentum
The first day of a Test match often determines the direction of the game. In India vs England 1st Tests, the opening sessions are usually dominated by bowlers who exploit fresh pitch conditions. The scorecard typically shows cautious batting with players focusing on survival rather than aggressive scoring.
England’s pace attack often targets early breakthroughs in overseas conditions, while India’s bowlers rely on movement and discipline. The scorecard highlights how early wickets or a steady opening partnership can influence the rest of the match significantly.
| Team | Runs | Wickets | Overs | Session Impact |
| India | 85 | 2 | 30 | Stable Start |
| England | 90 | 3 | 32 | Early Breakthroughs |
First Innings Build Up and Batting Foundations
The first innings is crucial in any 1st Test match as it sets the base for the entire contest. Scorecards often reveal long partnerships and patient innings where batsmen aim to build a solid total.
India’s strength lies in middle order resilience, while England often depends on top order contributions. The scorecard reflects how partnerships of 100 plus runs can shift momentum and put pressure on the opposition bowlers.
| Team | Runs | Top Scorer | Balls | Partnership |
| India | 320 | 135 | 250 | 150 Runs |
| England | 280 | 110 | 210 | 120 Runs |
Bowling Impact and Key Wicket Moments
Bowling performances are clearly reflected in the scorecard during crucial phases of the match. Fast bowlers dominate early, while spinners come into play as the pitch starts to wear.
India’s spinners often control the middle sessions, while England’s seamers maintain pressure with consistent lines. The scorecard shows bowling figures that highlight control, breakthroughs, and match changing spells.
| Bowler | Team | Overs | Runs | Wickets |
| Bowler A | India | 25 | 70 | 4 |
| Bowler B | England | 22 | 65 | 3 |
Second Innings Pressure and Tactical Adjustments
The second innings of a 1st Test introduces pressure and tactical shifts. Teams often adjust strategies based on the first innings result. The scorecard reflects whether a team is playing aggressively to set a target or defensively to save the match.
India often builds pressure through spin, while England may rely on counter attacking batting. The scorecard shows how run rates change and wickets fall under pressure situations.
| Team | Runs | Wickets | Overs | Strategy |
| India | 250 | 8 | 85 | Defensive |
| England | 200 | 6 | 70 | Counter Attack |
Turning Points That Defined the Match
Every 1st Test has key turning points that are visible in the scorecard. These include sudden collapses, crucial partnerships, or exceptional bowling spells. Such moments often decide the outcome of the match.
Scorecards highlight these phases clearly through fall of wickets and partnership details. A collapse of four wickets in a short span or a game saving partnership can completely change the momentum.
| Moment | Team | Impact | Result Shift |
| Collapse | England | 4 Wickets | India Advantage |
| Partnership | India | 120 Runs | Match Control |
Result and Match Summary Insights
The final scorecard provides a complete summary of the match, showing totals, wickets, and overall performance. It reflects how each session contributed to the final result.
India vs England 1st Tests are often closely fought, with results depending on execution in key moments. The scorecard serves as a detailed record of performance across all departments.
| Team | Final Score | Result | Key Player |
| India | 570 | Win | Top Batter |
| England | 480 | Loss | Lead Bowler |
Conclusion
The India National Cricket Team vs England Cricket Team 1st Test match scorecard captures the essence of classic Test cricket. From cautious starts to intense finishes, every detail reflects strategy and endurance. These scorecards not only record numbers but also tell the story of how matches unfold over five days, making them essential for understanding this historic rivalry.